| |
 |
| |
|
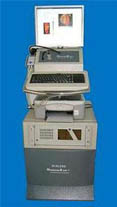 |
This Machine uses
specialised data acquisition method followed by precision
digital signal processing (DSP) techniques to obtain minute
changes that take place in our cardiovascular system every mili-second.
The acquired data consists of pulsatile changes that occur due
to blood flow during systole and diastole, changes due to the
breathing activity, electrical and mechanical activity during
the entire cardiac cycle.A Special device called “Vertical
Acceleration Detector” or VAD is used together with DSP
techniques to record the flow pattern (laminar or turbulent)
during various instances of the cardiac cycle, together with the
signals pertaining to the opening and closing of the Mitral and
Aortic valve.
The acquired Information from every
beat for 256 beats during a procedure is used to measure the
Volumes, the Pressures, and Inter and Intra-cycle timings. Flow
of Blood into the Heart, out of the Heart and into the coronary
circulation is then computed during various times of the Cardiac
cycle (Blood flow is a function of the Pressure, Volume and
Time). It is Important to know that Blood flowing into the
heart, out of the heart and into the coronary system takes place
at different moment of time within the same cardiac cycle |
|
The
Cardiac Cycle
|
 |
The Cardiac Cyle - Non-Invasively
obtained dV/dt Curve. Time related with other physiological
curve, as produced by Haemoseis 256™
- Every Event during every
single cycle Occurs at Precise times.
- Primary Importance to
understand CCG is to understand what happens and when.
- Never before has it been
possible to obtain such critical Information on the
Cardiac Cycle Non-Invasively
|
|
Cardiovascular
Cartography (CCG) is a tetrapolar lead system with
paired inner electrodes placed on either side in the supraclavicular
fossa just above the level of the suprasternal notch, and along the
midaxillary line at the level of the xiphoid.
|
|
 |
|
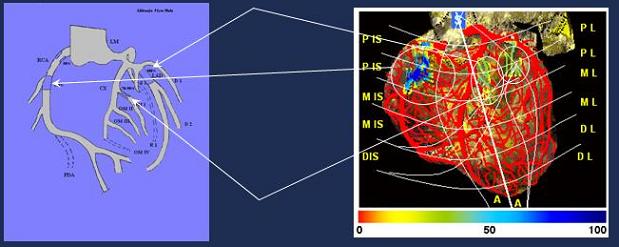
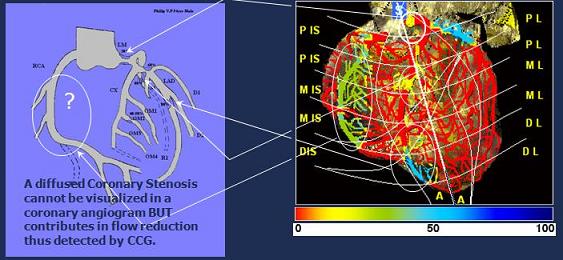
Comparison
with Coronary Angiography
|
|
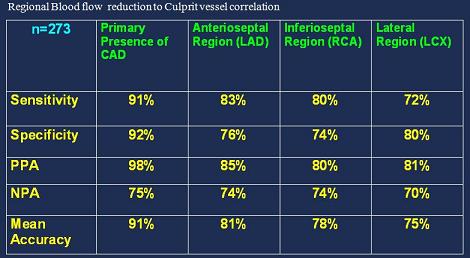 |
- Source : IEEE CBMS-2001, 26-27 July
2001, National Institute of Health, Bethesda, Maryland, USA
|
|
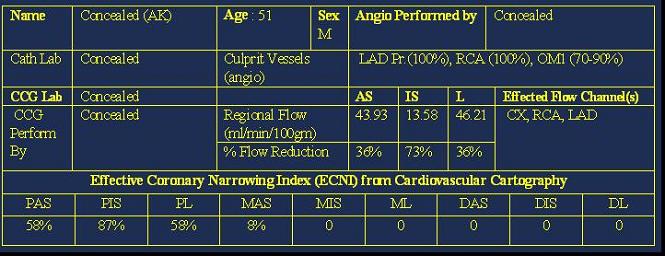
Example of Case Studies with 3DCCG
and
Coronary
Angiography
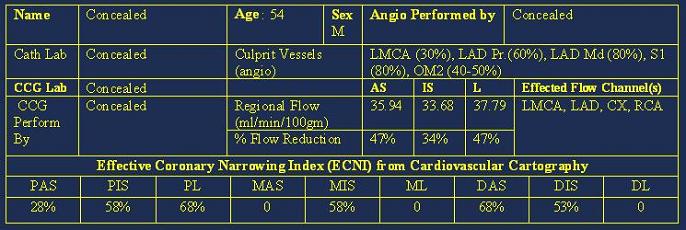
Study-1 |
|
 |
|
|
|
|
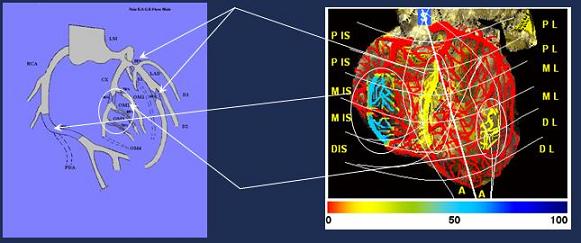
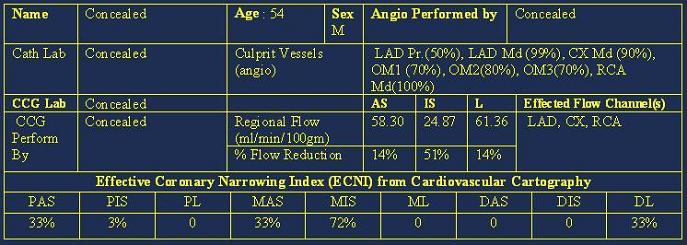
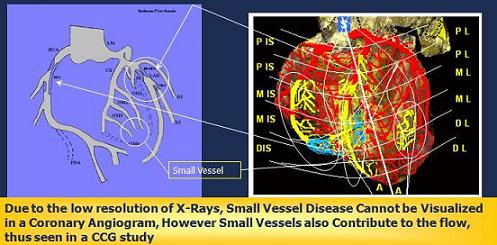
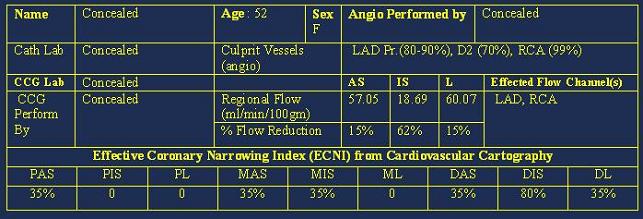
Study-2 |
|
|
|
|
|
|
|
Study-3 |
| |
|
|
|
|
|
|
Study-4 |
|
|
|
|
|
|
|
|
 |